
Calculate mean squared error from predictions and actual values
Compare predictions with actual values by averaging squared errors for each model. Count only pairs with both values present.
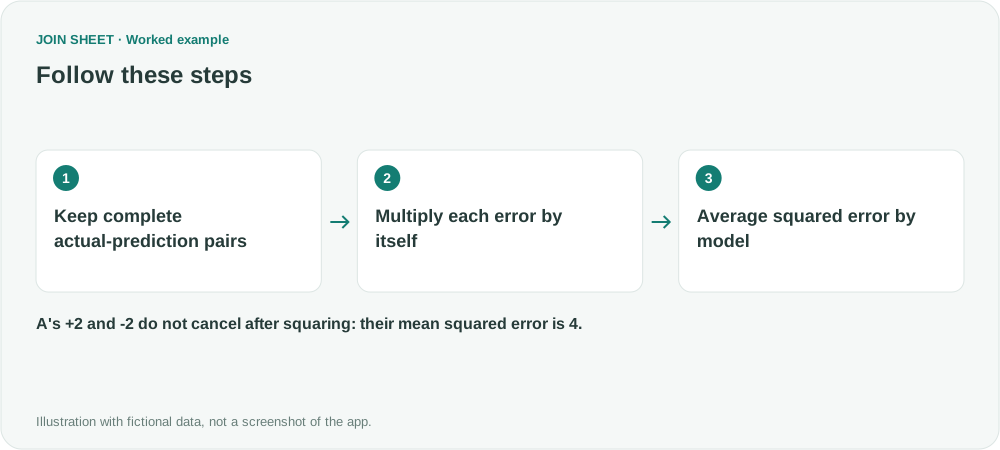
Errors of +2 and −2 average to zero even though neither prediction is exact. In JOIN SHEET, multiply each error by itself before averaging to calculate mean squared error, or MSE, without that cancellation.
Align actuals and predictions on each row
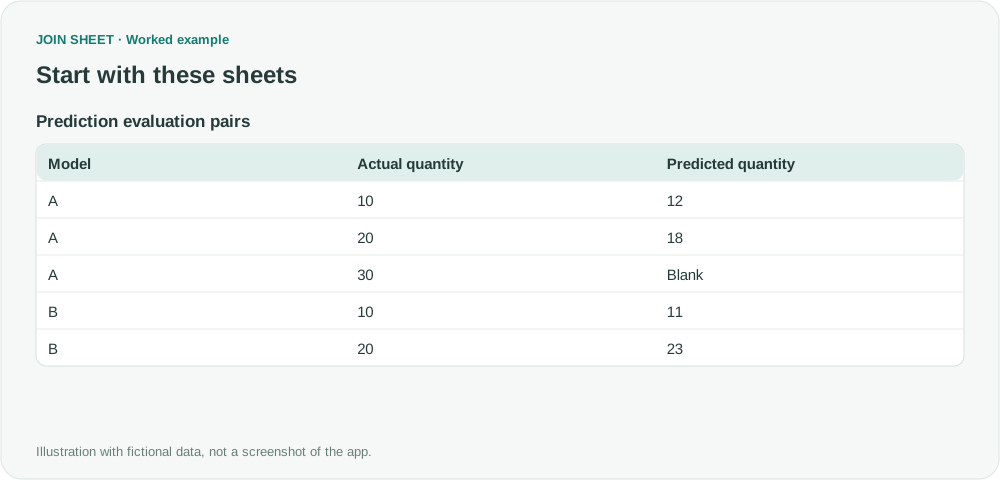
Each row in this fictional example pairs a prediction with the actual quantity for the same case and period. Leave out rows missing either value and report how many complete pairs remain. A missing prediction for model A is not a prediction of zero. Blank in the table means an empty cell, not the word to enter.
| Model | Actual quantity | Predicted quantity |
|---|---|---|
| A | 10 | 12 |
| A | 20 | 18 |
| A | 30 | Blank |
| B | 10 | 11 |
| B | 20 | 23 |
Subtract, square, then average
- Select the data as the result source and check that Actual quantity and Predicted quantity are numeric. In Refine results, add a Filter with Is not empty for each of those fields. Review values that failed numeric conversion before excluding them.
- Add Calculate: Predicted quantity minus Actual quantity, named Prediction error.
- Add another calculation with Prediction error on both sides and multiply. Name it Squared error.
- Add Summarize grouped by Model. Change Summary method to Average, select Squared error, and enter Mean squared error in Output field name. Choose Add summary within the same step, keep Count, and name it Evaluation count. Choose Apply.
Check each model's error and number of evaluated pairs
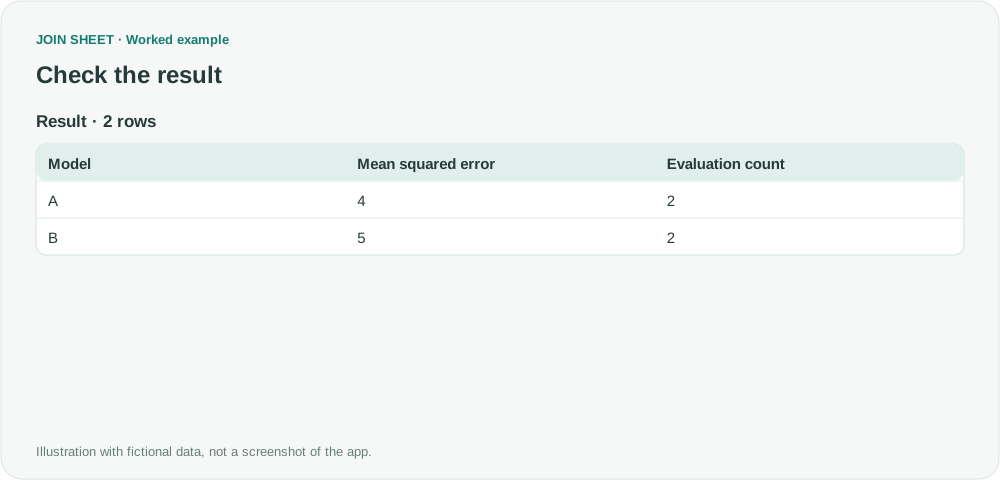
A averages squared errors of 4 and 4 to get 4. B averages 1 and 9 to get 5. Each uses two complete numeric pairs, so Evaluation count is 2. MSE has squared quantity units: a result of 4 does not mean 4%. It is also not RMSE, which takes a square root.
| Model | Mean squared error | Evaluation count |
|---|---|---|
| A | 4 | 2 |
| B | 5 | 2 |
The source question concerns the denominator in Excel's regression ANOVA output. Here, you are averaging squared errors for predictions you already have, not estimating regression residual variance with an n−p−1 adjustment. Compare models using the same cases and units. If missing data leaves them with different evaluation sets, their MSE values may not be directly comparable.
Try it with your own files
Start with JOIN SHEET ↗Use a desktop computer for Excel and CSV work.
Opens in a new tab without replacing your current work.
Example last verified:
Sources
The question MSE denominator informed this independently created fictional example.