
Find rows above their own group's average
Find values above their own group's average, even when they are below the overall average. Calculate each group's mean and join it back to the records.
If group A averages 15 and group B averages 6, a value of 8 is above average within B. One global threshold can miss that row. Build a per-group mean table, rejoin it to the original records and calculate each row's difference.
Each group has a different benchmark
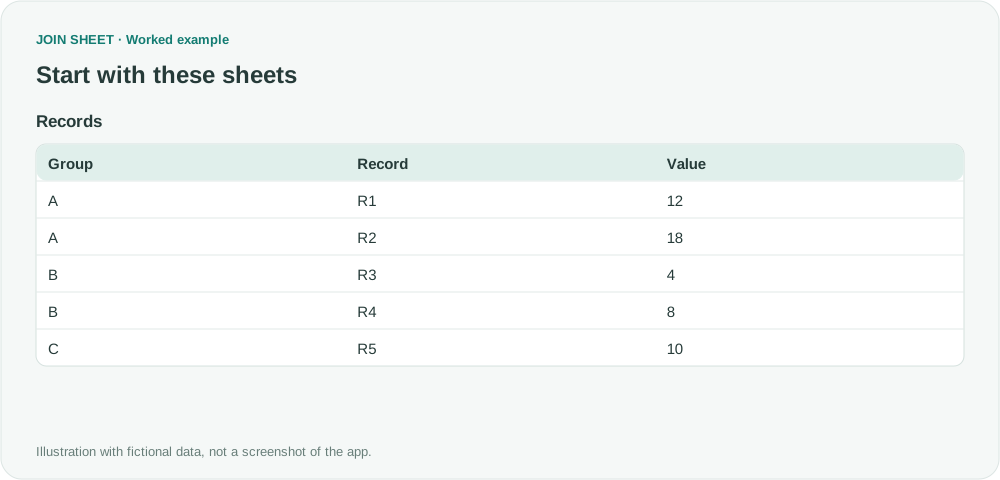
The fictional Records table has a global average of 10.4, but this task uses A=15, B=6 and C=10. Means is the summary saved in the first stage. Each record contributes to its group's mean before we select values strictly above that mean.
Records
| Group | Record | Value |
|---|---|---|
| A | R1 | 12 |
| A | R2 | 18 |
| B | R3 | 4 |
| B | R4 | 8 |
| C | R5 | 10 |
Means
| Group | Mean |
|---|---|
| A | 15 |
| B | 6 |
| C | 10 |
Save means, rejoin details, then filter the difference
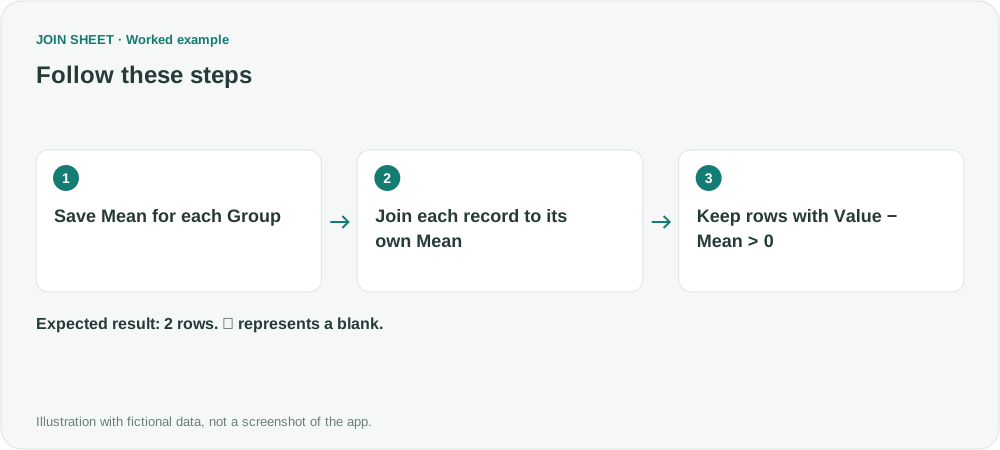
- Load Records alone and select it. Open Refine results and choose Summarize. Select Group under Group by, choose Average as the Summary method, select Value, and enter Mean in Output field name. Click Apply, check A=15, B=6 and C=10, then use Save results to save this summary as an Excel file.
- In a new workspace, reload the original Records and saved Means. Join Group to Group with matching rows only. Means must have one row per group.
- Hide only the Group column from Means, leaving Mean visible. In a new Refine results → Calculate step, choose Subtract · A − B, with A=Value, B=Mean and output name Excess.
- Add a Filter step below the calculation: Excess, Greater than, 0. Keep the calculation before the filter and apply.
- Verify that only R2 and R4 remain. Group C's sole record R5 equals its own mean, so it is excluded.
Rows a global-average filter would miss
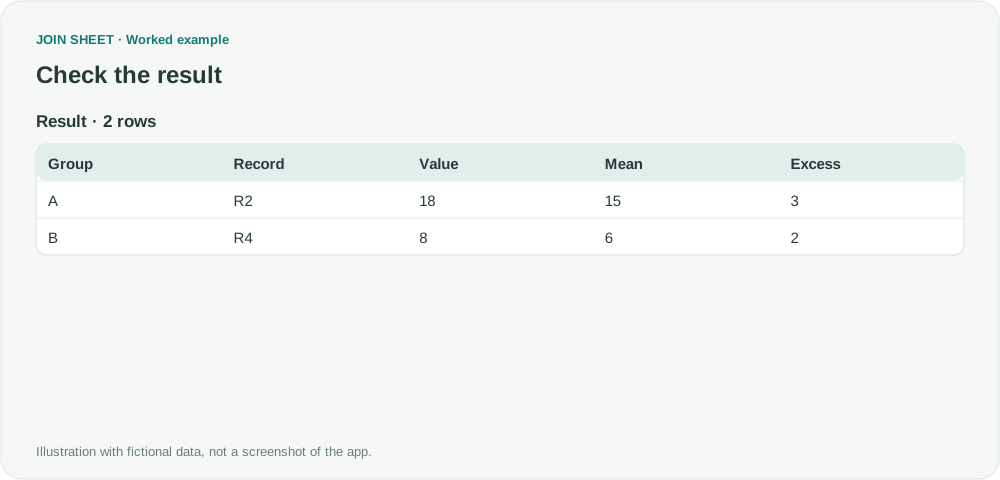
R4's value 8 is below the global average of 10.4 but above B's mean of 6, so it is included. Each output row still represents an original record, not a grouped summary.
| Group | Record | Value | Mean | Excess |
|---|---|---|---|---|
| A | R2 | 18 | 15 | 3 |
| B | R4 | 8 | 6 | 2 |
Decide which records should contribute to the average
A filter on the source changes which records contribute to the average. If you want to check only some records against the average of all records, calculate the average from the full set first. Blank and nonnumeric values are excluded from numeric averages and differences, while real zeros count toward the average. Repeat the save, reload and join steps yourself when the data changes; this workflow does not run a SQL window function or refresh automatically.
Try it with your own files
Start with JOIN SHEET ↗Use a desktop computer for Excel and CSV work.
Opens in a new tab without replacing your current work.
Example last verified:
Sources
How to select students who got above average? (Stack Overflow)
This SQL question asks how to find students whose grades exceed their own group's mean. The guide applies that idea to fictional records using manual save, reload and join steps in JOIN SHEET. It is not based on the author's data or product feedback.